- Mussel Culture Problems
- a) Total Wet weight (TWw) decline
- b) Stable price for decades
- c) Environmental quality
- d) Pollution (Land and Sea)
- e) Epibionts
- f) Lack of scientific information for best musselculture practices
- g) Lack of financial data for the musselculture sustainability
- h) Harmonisation with EU and national legislation and implementation
Mussel Culture Problems
The mussel culture problems in Greece are presented below.
a) Total Wet weight (TWw) decline
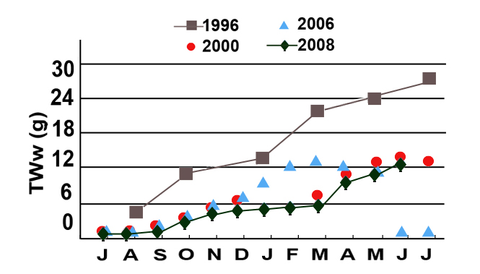
Figure. Monthly fluctuation of the mussel total wet weight in Chalastra, Thessaloniki, according to Kravva (1996), HCMR (2001), ATEITH (2007), Tsiaras & Galinou-Mitsoudi (2013).
b) Stable price for decades
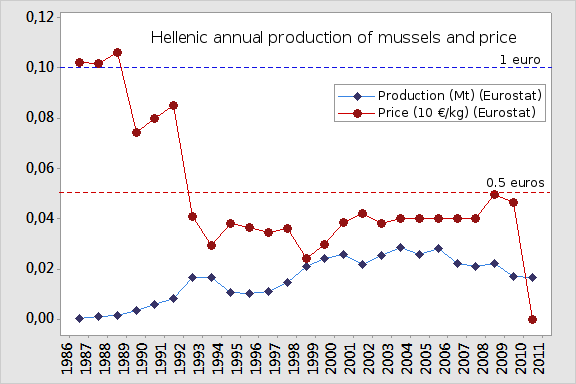
Figure. Left: The Hellenic annual production of mussels. Right: The mussel price/kg during 1987-2011.
c) Environmental quality
Limited Food Availabilty
Water Quality
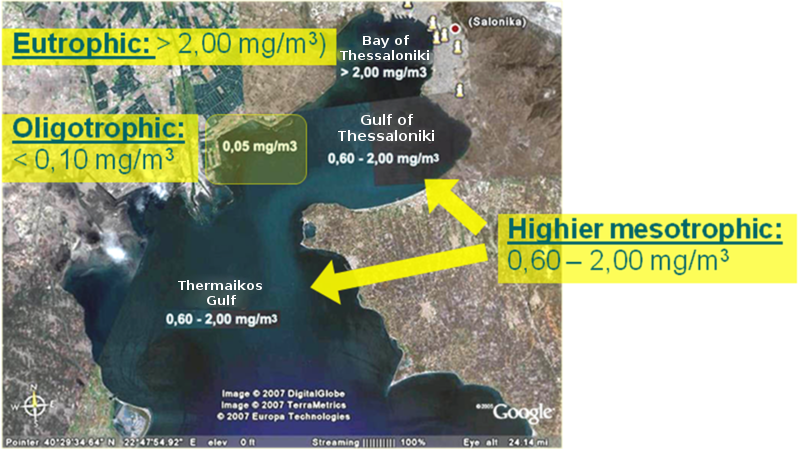
Figure. Chl-a in Thermaikos Gulf (ΕΚΘΕ 2001, SoHelme 2005, ΑΤΕΙΘ 2007). The light yellow orthogonal (0.05 mg/m3) is the study area with mussel farms.
Sea Currents
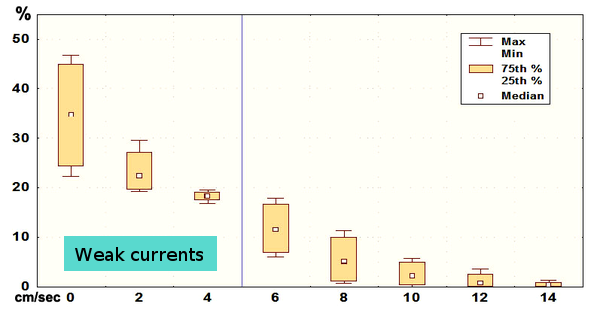
Figure. Sea currents’ frequency in the study area in the year 2000 (from ΕΚΘΕ, 2001).
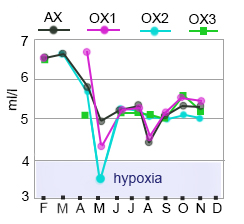
Temperature and Dissolved Oxygen
 |
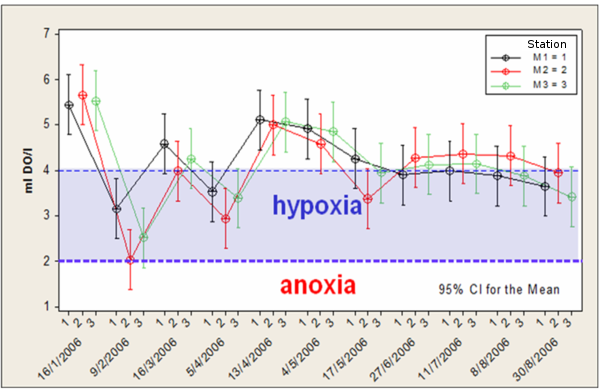 |
Figure. Dissolved Oxygen: Left in the year 2000 and right in the year 2006.
d) Pollution (Land and Sea)
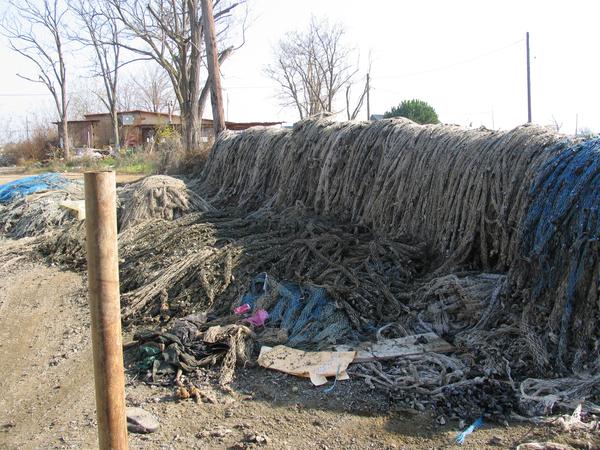
Figure. Used sock nets in the beach.
e) Epibionts
3-4 kg per 3 m sock (Lemonaki, 2011) or about 9 tons per ha.
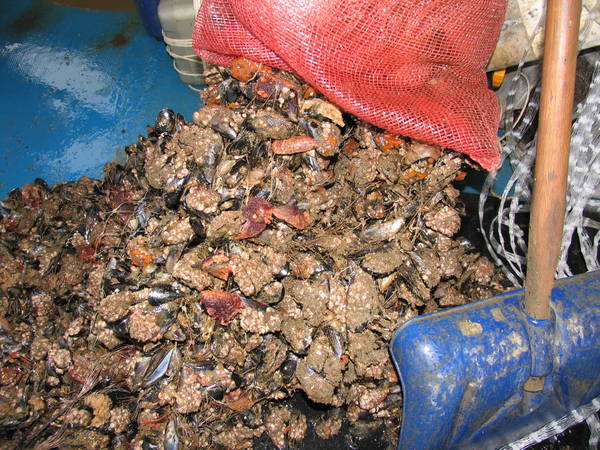
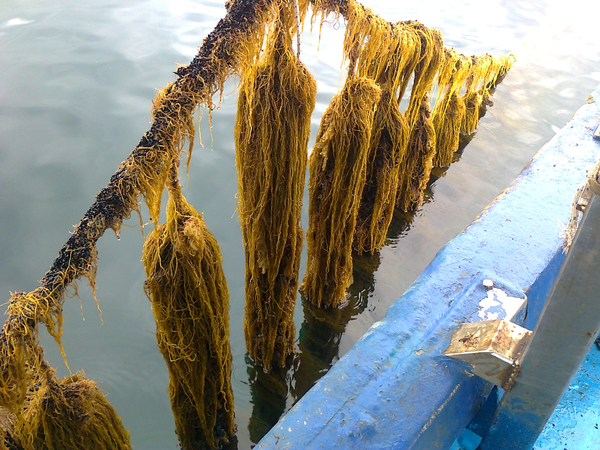
Figure. Epibionts.
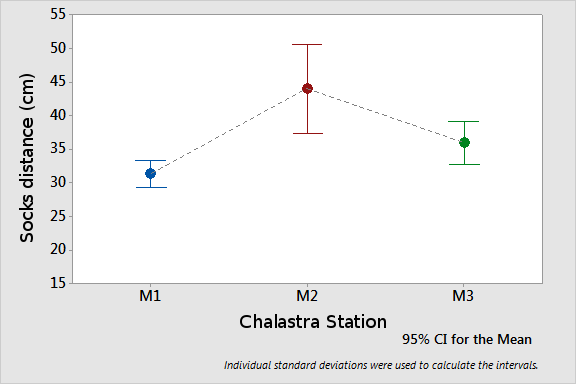
f) Lack of scientific information for best musselculture practices
 |
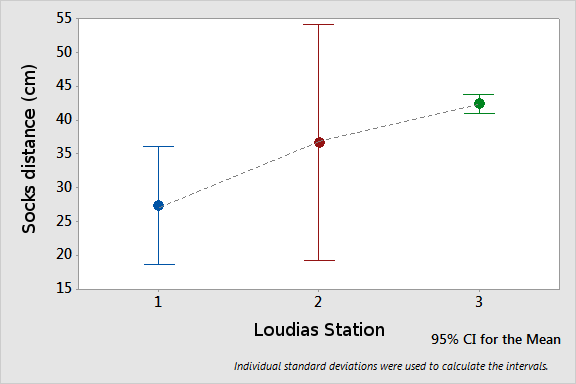 |
Figure. Socks distance in long-line musselculture. Left: Chalastra (ATEITH, 2007). Right: Loudias (Antonopoulou, 2009).